
This blog will provide the latest updates about the past and present of the Microsoft PL-300, learning resources, how to prepare for the exam, and the PL-300 exam practice tests. (Emphasis added: it’s the latest!)
Blogs include:
- About the past and present of the Microsoft PL-300 exam
- Up-to-date study resources for the PL-300 exam (updated April 2024) (including web links, books, online courses, and practice tests)
- How to prepare for the Microsoft PL-300 exam to earn a certification
- Salary & Employment Advice After Becoming a PL-300 Power BI Data Analyst Associate
About the past and present of the Microsoft PL-300 exam
Past life of the PL-300 exam
Speaking of the birth of the Microsoft PL-300 exam, we must mention the Microsoft DA-100 exam. On March 31, 2022, the Microsoft DA-100 exam was officially discontinued, and the PL-300 exam appeared.
It is used as an alternative to the DA-100 exam.
Microsoft DA-100 vs. Microsoft PL-300
Because Microsoft PL-300 is a Microsoft DA-100 replacement exam, then both must have the same knowledge points. However, the PL-300 is not exactly equivalent to the DA-100 exam. You need to note: The PL-300 reorganizes the exam structure, merging the number of subject areas, and giving different weights (i.e., testing) various topics.
Just went through what happened to the updated Microsoft PL-300 exam
You should know that the Microsoft PL-300 exam was updated the other day (April 23, 2024). You must pay attention to the updated content, which is very important for you to pass the PL-300 exam.
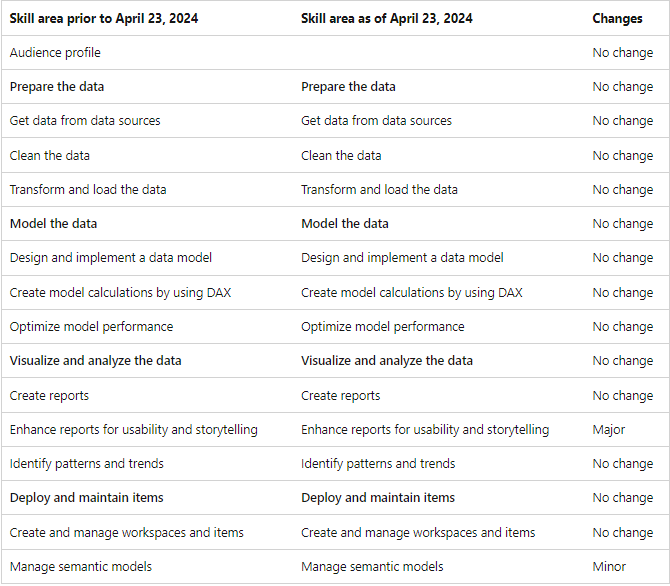
Certification Exam Name: Exam PL-300: Microsoft Power BI Data Analyst
Exam Cost: $165 in the United States
Prerequisites for taking the exam: Expertise in designing and developing scalable data models with expertise in cleaning and transforming data. Use advanced analytics to generate informative data visualizations.
Exam Duration: 100 minutes (1 hour 40 minutes)
Total questions: 40-60 multiple-choice questions (with 1 case study)
Pass Score: A minimum of 700 points
Exam mode: invigilated by invigilators, closed-book mode
Percentage of areas assessed: Preparing data (25-30%), data modeling (25-30%), visualizing and analyzing data (25-30%), deploying and maintaining projects (15-20%)
Scouting capabilities: Provide actionable insights by processing available data and applying domain expertise. Collaborate with enterprise data analysts and data engineers to identify and ingest data. Proficient in writing expressions with Power Query and Data Analysis Expressions (DAX).
Post-Certification: Complete the PL-300 exam to earn the Microsoft Power BI Data Analyst Associate certification
How to prepare for the Microsoft PL-300 exam to earn a certification
Want to know how to prepare for the Microsoft PL-300 exam? Follow me and do so to get the Microsoft PL-300 Power BI certificate easily.
1. Browse Microsoft’s official exam guide. When you buy a new product, you need to read the manual to get started quickly. Similarly, you should also read the official exam instructions for the exam, and the official PL-300 study guide should be read
2. Follow the official Learning Path through the knowledge points
3. Watch the official exam preparation videos carefully, there are a total of 4 videos
- Preparing for PL-300-Prepare the Data(1 of 4)
- Preparing for PL-300: Model the data (segment 2 of 4)
- Preparing for PL-300: Visualize and analyze the data (segment 3 of 4)
- Preparing for PL-300: Deploy and maintain assets (segment 4 of 4)
4. The most important thing is to take more PL-300 mock tests! If you want to find free PL-300 practice test questions, you can download a free demo from the Pass4itSure website or take it directly below (I’ll share it), but if you need more, it’s best to buy the full PL-300 practice questions (PDF) for $45.99.
Brush it carefully 2-3 times greatly improves the success rate. It is important to pay attention to the problems you have made wrong and go to the learning path to find the relevant topics thoroughly.
Finally, to add: certificates are not an end. Eventually, we need to be able to use Power BI for data analysis/visualization and master the DAX language.
Up-to-date study resources for the PL-300 exam
Microsoft Official PL-300 Exam Prep Video:
Preparing for PL-300 – Prepare the Data (1 of 4)
Preparing for PL-300 – Model the Data (2 of 4)
Preparing for PL-300 – Visualize and Analyze the Data (3 of 4)
Preparing for PL-300 – Deploy and Maintain Assets (4 of 4)
Microsoft Official PL-300 Documentation:
Microsoft Certified: Power BI Data Analyst Associate – Certifications:https://learn.microsoft.com/en-us/credentials/certifications/data-analyst-associate/?source=recommendations&practice-assessment-type=certification
Exam DA-100: Analyzing Data with Microsoft Power BI – Certifications:https://learn.microsoft.com/en-us/credentials/certifications/exams/da-100/?source=recommendations
Microsoft Certified: Power BI Data Analyst Associate – Certifications: https://learn.microsoft.com/en-us/credentials/certifications/data-analyst-associate/?source=recommendations&practice-assessment-type=certification
Get started with Microsoft data analytics:https://learn.microsoft.com/en-us/training/paths/data-analytics-microsoft/?source=recommendations
Demo exam website for Microsoft Exam Sandbox: https://www.starttest.com/ITDVersions/22.0.0.0/ITDStart.aspx?SVC=eba945fd-a19b-41df-ba06-2fa06da4f43a
Mindhub offers official Microsoft PL-300 exam practice tests: https://www.mindhub.com/pl-300-microsoft-power-bi-data-analyst-microsoft-official-practice-test/p/MU-PL-300?utm_source=microsoft&utm_medium=certpage&utm_campaign=msofficialpractice
Book:
Exam Ref PL-300 Power BI Data Analyst 1st Edition – Daniil Maslyuk https://www.amazon.com/Exam-Pl-300-Power-Data-Analyst/dp/0137901232/ref=sr_1_4?crid=GH6HJ0ICEAAN&keywords=PL-300&qid=1651195321&s=books&sprefix=pl-300%2Cstripbooks%2C106&sr=1-4
Learn Power BI – Second Edition: A comprehensive, step-by-step guide for beginners to learn real-world business intelligence 2nd ed. Edition – Greg Deckler https://www.amazon.com/Learn-Power-comprehensive-step-step/dp/1801811954/ref=sr_1_1?crid=2LZ7DG33J4DMI&keywords=Learn+Power+BI%2C+2nd+Edition&qid=1651195732&s=books&sprefix=learn+power+bi%2C+2nd+edition%2Cstripbooks%2C180&sr=1-1
The Definitive Guide to DAX: Business intelligence for Microsoft Power BI, SQL Server Analysis Services, and Excel, 2e Paperback – 15 September 2020 – Marco Russo and Alberto Ferrari https://www.amazon.in/Definitive-Guide-DAX-intelligence-Microsoft/dp/9353945488/ref=pd_sim_1?pd_rd_w=hroQv&pf_rd_p=b8f390fe-1305-4c9a-947f-e7cfa798ce77&pf_rd_r=NCY9SPTE046H7ED092FT&pd_rd_r=35db9aba-a805-44ad-8baa-c2e0e3ace585&pd_rd_wg=uYHgh&pd_rd_i=9353945488&psc=1
Microsoft Power BI Data Analyst Certification Guide: A comprehensive guide to becoming a confident and certified Power BI professional – Orin Edenfeld and Edward Coran https://www.amazon.com/dp/1803238569?&linkCode=sl1&tag=sharpsql-20&linkId=23f1b9d2dfc10efd71eefb617bf59d49&language=en_US&ref_=as_li_ss_tl
Free online Microsoft PL-300 practice test questions 1-15 by Pass4itSure
Question 1:
HOTSPOT
You have a Power BI imported dataset that contains the data model shown in the following exhibit.
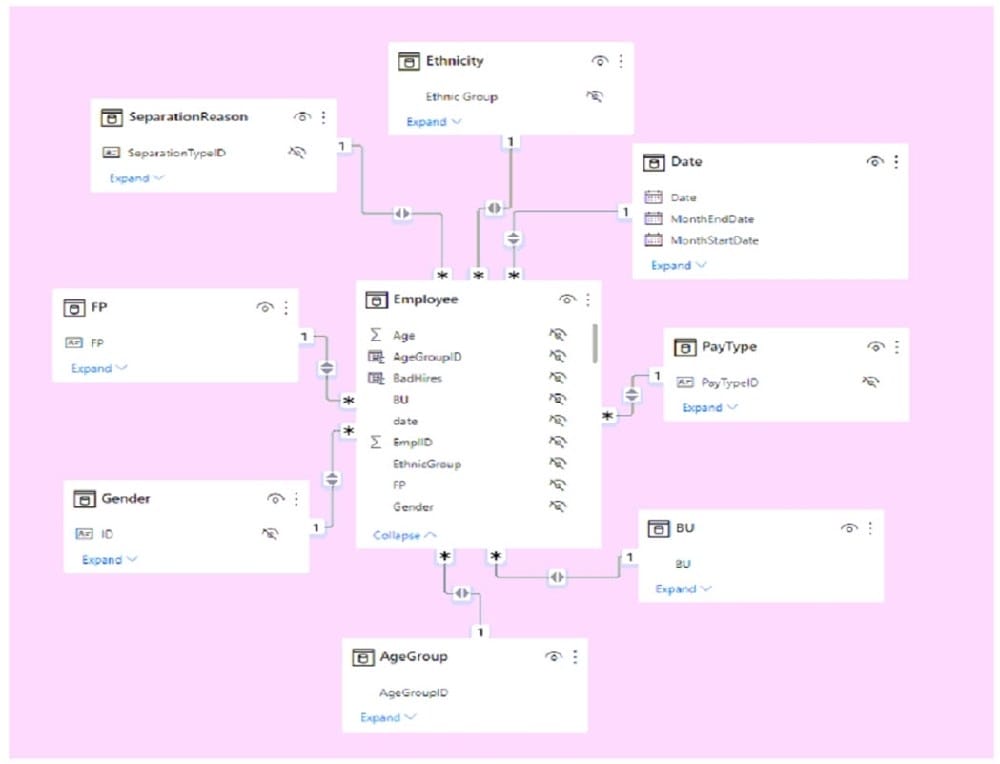
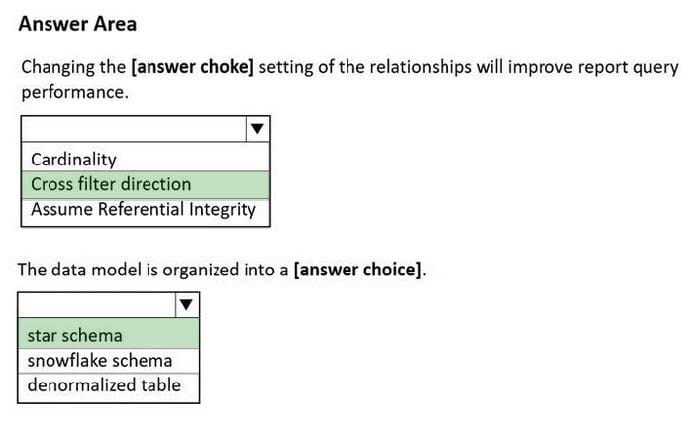
Use the drop-down menus to select the answer choice that completes each statement based on the information presented in the graphic. NOTE: Each correct selection is worth one point.
Hot Area:
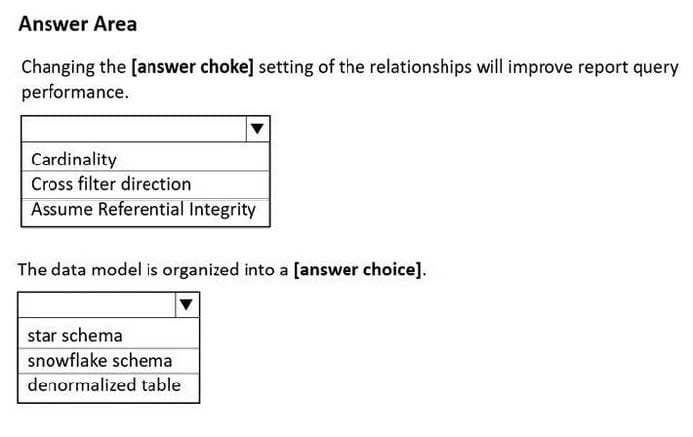
Correct Answer:
Question 2:
You have a Power BI report named Report\’ and a dashboard named Dashboard\’. Report1 contains a line chart named Sales by month.
You pin the Sales by month visual to Dashboard1.
In Report1, you change the Sales by month visual to a bar chart.
You need to ensure that the bar chart displays on Dashboard\’,
What should you do?
A. Refresh the dataset used by Report1 and Dashboard1.
B. Select Refresh visuals for Dashboard1.
C. Edit the details for the dashboard tile Of Dashboar1.
D. Pin the Sales by month bar chart to Dashboard1.
Correct Answer: A
Question 3:
HOTSPOT
The table has the following columns.
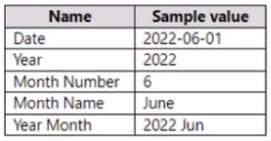
You need to add a column that will be used to sort the Year Month column chronologically.
Hot Area:

Correct Answer:

Question 4:
You are creating a sales report in Power Bl for the NorthWest region sales territory of your company. Data will come from a view in a Microsoft SQL Server database. A sample of the data is shown in the following table:
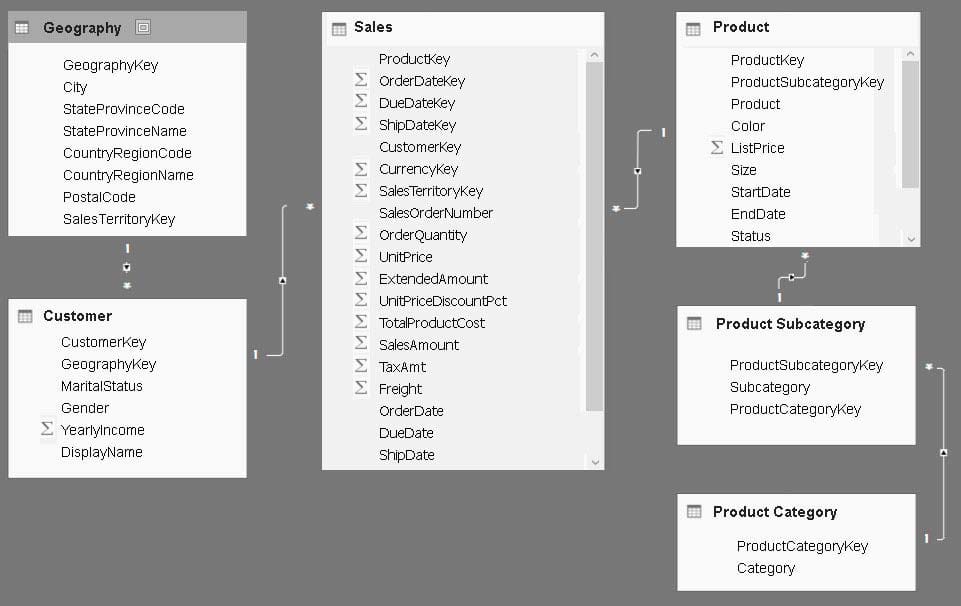
The report will facilitate the following analysis:
1.The count of orders and the sum of total sales by Order Date
2.The count of customers who placed an order
3.The average quantity per order
You need to reduce data refresh times and report query times.
Which two actions should you perform? Each correct answer presents part of the solution
NOTE: Each correct selection is worth one point.
A. Set the data type for SalesOrderNumber to Decimal Number.
B. Remove the CustomerKey and ProductKey columns.
C. Remove the TaxAmt and Freight columns.
D. Filter the data to only the NorthWest region sales territory.
Correct Answer: CD
C: Remove columns that are not used in the report.
D: Reduce the number of rows.
Incorrect:
Not A: Not possible.
Not B: Need CustomerKey to count customers who placed an order
Question 5:
You merge data from Sales. Region, Region_Manager, Sales_Manager, and Manager into a single table named Region. What should you do next to meet the reporting requirements of the executives?
A. Apply row-level security (RLS) to the Region table based on the sales manager username.
B. Configure a bi-directional relationship between Region and Sales. Region.
C. Create a DAX calculated column that retrieves the region manager from the Weekly.Returns table based on the sales.regionjd column.
D. In the Region table, create a hierarchy that has the manager name, and then the sales manager name.
Correct Answer: C
Question 6:
DRAG DROP
You are creating a Power BI model and report.
You have a single table in a data mode) named Product Product contains the following fields:
1.ID
2.Name
3.Color
4.Category
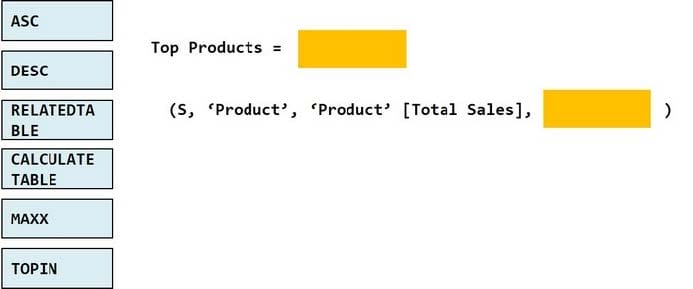
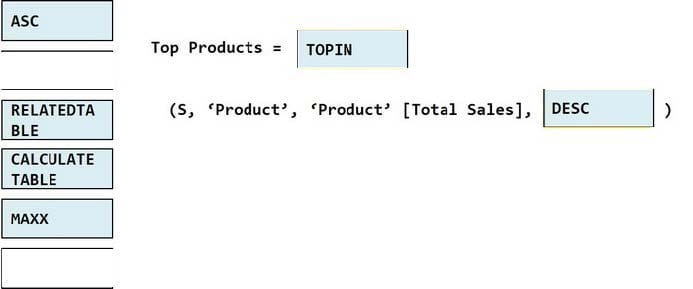
5. Total Sales You need to create a calculated table that shows only the top eight products based on the highest value in Total Sales. How should you complete the DAX expression? To answer, drag the appropriate values to the coned targets. Each value may be used once, more than once, or not at all. You may need to drag the split bar between panes or scroll to view content.
Select and Place:
Correct Answer:
Question 7:
You have a query that returns the data shown in the following exhibit.

You need to configure the query to display the data as shown in the following exhibit.
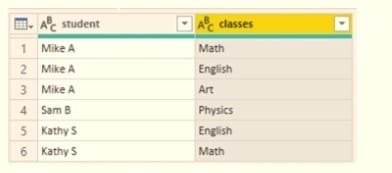
Which step should you use in the query?
A. =Table.ExpandListColum(Table.TransformColunins(Source, {{“classes”.Splitter.SplitTextByDelimiter(\’\’,\’\’, QuoteStyle.None), let itemType – (type nullable text) meta [Serialized.Text = true] in type {itemType}}}), “classes”)
B. = Table.Unpivot(Source, {“classes”}, “Attribute”, “Value”)
C. = Table.SplitColumn(Source, “classes”. Splitter.SplitTextByDelimiterf”,”, QuoteStyle.None), {“classes.1”})
D. = Table.SplitColumn(Source, “classes”. Splitter.SplitTextByPositions({10}), {“classes.1”})
Correct Answer: B
Power Query Unpivot columns: You might want to unpivot data, sometimes called flattening the data, to put it in a matrix format so that all similar values are in one column. This is necessary, for example, to create a chart or a report.
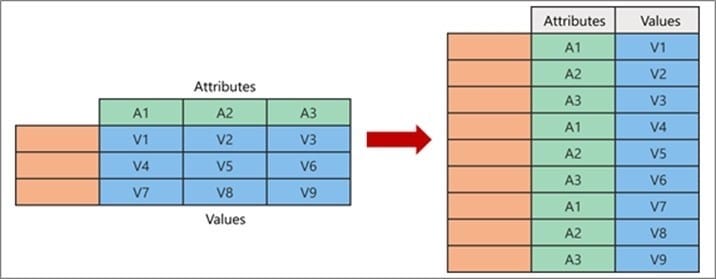
Chart
Note:
Syntax: Table.Unpivot(table as table, pivot columns as list, attribute column as text, value column as text) as table
Table. Unpivot translates a set of columns in a table into attribute-value pairs, combined with the rest of the values in each row.
Reference:
https://docs.microsoft.com/en-us/power-query/unpivot-column
https://docs.microsoft.com/en-us/powerquery-m/table-unpivot
Question 8:
You plan to embed multiple visualizations in a public website.
Your Power BI infrastructure contains the visualizations configured as shown in the following table.
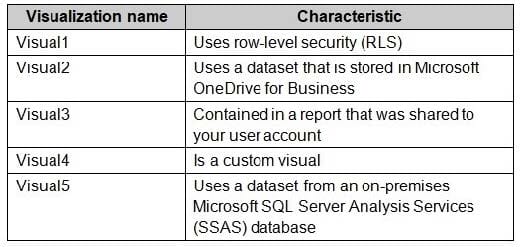
Which two visualizations can you embed into the website? Each correct answer presents a complete solution. NOTE: Each correct selection is worth one point.
A. Visual1
B. Visual2
C. Visual3
D. Visual4
E. Visual5
Correct Answer: BD
References: https://docs.microsoft.com/en-us/power-bi/service-publish-to-web
Question 9:
You build a Power BI report that displays loT temperature data streaming from a refrigerator.
You publish the report to the Power BI service.
You need to be notified when the temperature rises above four degrees Celsius.
What should you do?
A. Set an alert on a KPI visual in the report.
B. Pin a card visual into a dashboard and create a subscription.
C. Pin a card visual to a dashboard and set an alert on the tile.
D. Pin a report page to a dashboard and set an alert on the page.
Correct Answer: A
Question 10:
HOTSPOT
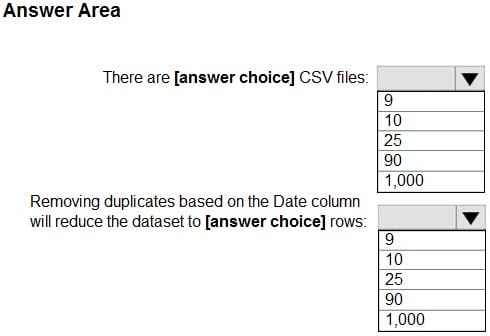
You view a query named Transactions as shown in the following exhibit.
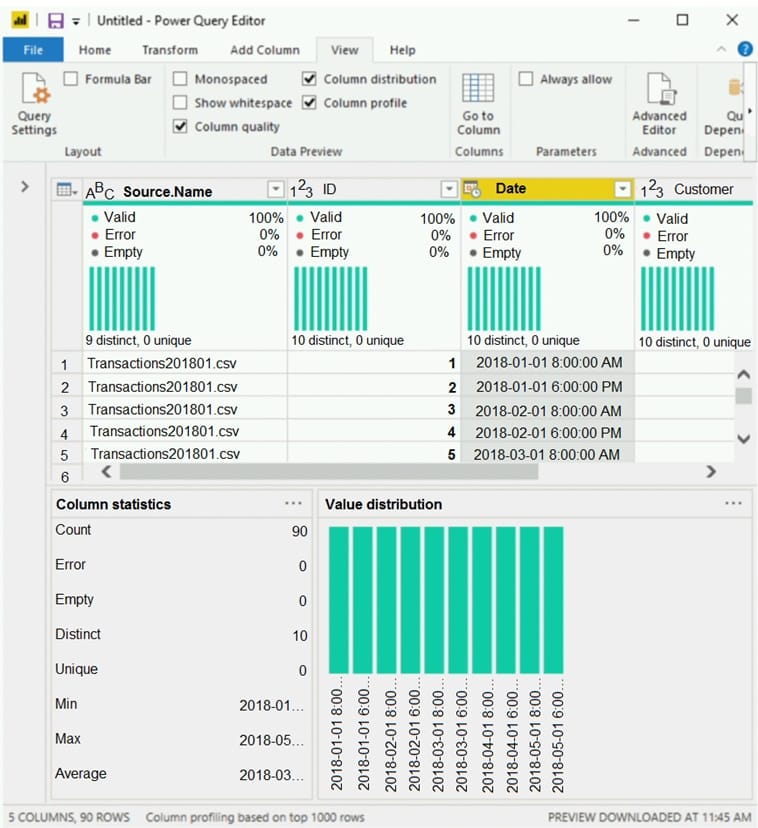
The query gets CSV files from a folder.
Use the drop-down menus to select the answer choice that completes each statement based on the information presented in the graphic.
NOTE: Each correct selection is worth one point.
Hot Area:
Correct Answer:
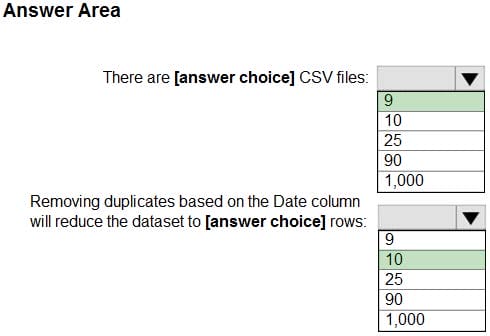
Box 1: 9
9 distinct CSV files.
Box 2: 10
10 distinct dates.
Question 11:
You have a Microsoft Power BI data model that contains three tables named Orders, Date, and City. There is a one-to-many relationship between Date and Orders and between City and Orders.
The model contains two row-level security (RLS) roles named Role1 and Role2. Role1 contains the following filter.
City[State Province] = “Kentucky”
Role2 contains the following filter.
Date[Calendar Year] = 2020
If a user is a member of both Role1 and Role2, what data will they see in a report that uses the model?
A. The user will see data for which the State Province value is Kentucky and the Calendar Year is 2020.
B. The user will see data for which the State Province value is Kentucky or the Calendar Year is 2020.
C. The user will see only data for which the State Province value is Kentucky.
D. The user will receive an error and will not be able to see the data in the report.
Correct Answer: B
When a report user is assigned to multiple roles, RLS filters become additive. It means report users can see table rows that represent the union of those filters.
Reference: https://docs.microsoft.com/en-us/power-bi/guidance/rls-guidance
Question 12:
DRAG DROP
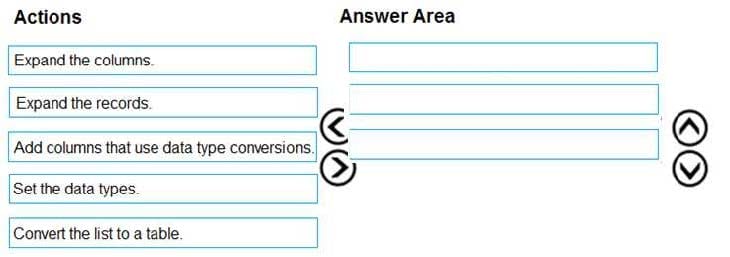
You are building a dataset from a JSON file that contains an array of documents.
You need to import attributes as columns from all the documents in the JSON file. The solution must ensure that data attributes can be used as date hierarchies in Microsoft Power BI reports.
Which three actions should you perform in sequence? To answer, move the appropriate actions from the list of actions to the answer area and arrange them in the correct order.
Select and Place:
Correct Answer:
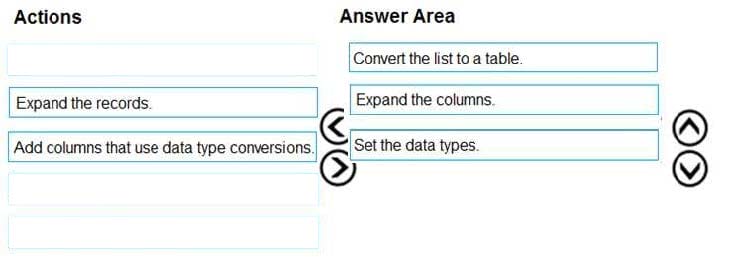
1- Convert list to table 2- Expand Column 3- Set Date type
Here is an example: https://youtu.be/B4kzyxnhQfI
The definition of the function that expands columns: https://docs.microsoft.com/en- us/power query-m/table-expandrecordcolumn
Question 13:
DRAG DROP
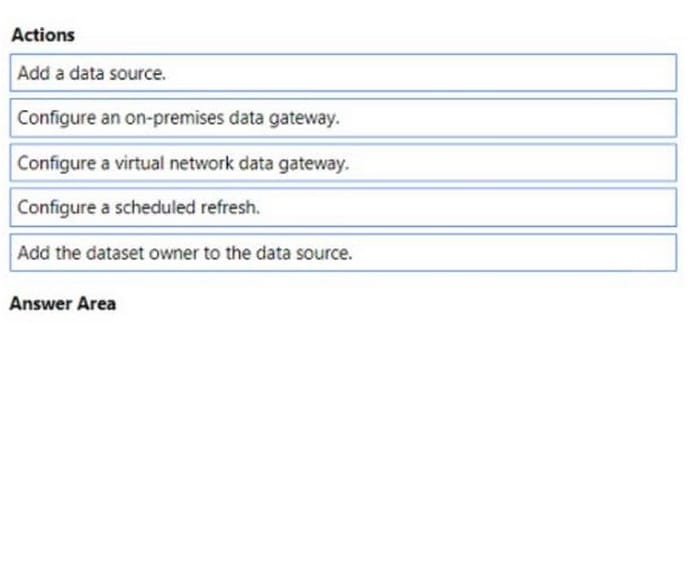
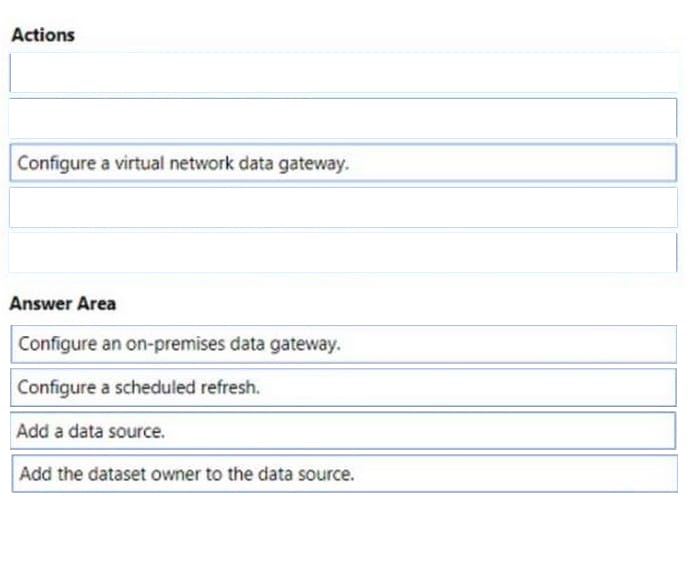
You publish a dataset that contains data from an on-premises Microsoft SQL Server database.
The dataset must be refreshed daily.
You need to ensure that the Power BI service can connect to the database and refresh the dataset.
Which four actions should you perform in sequence?
To answer, move the appropriate actions from the list of actions to the answer area and arrange them in the correct
Select and Place:
Correct Answer:
Question 14:
You need to recommend a strategy to consistently define the business unit, department, and product category data and make the data usable across reports.
What should you recommend?
A. Create a shared dataset for each standardized entity.
B. Create dataflows for the standardized data and make the dataflows available for use in all imported datasets.
C. For every report, create and use a single shared dataset that contains the standardized data.
D. For the three entities, create exports of the data from the Power Bl model to Excel and store the data in Microsoft OneDrive for others to use as a source.
Correct Answer: B
Question 15:
You manage a Power BI model that has a table named Sales and Product.
You need to ensure that a sales team can view only data that has a CountryRegionName value of United States and a ProductCategory value of Clothing.
What should you do from Power BI Desktop?
A. From Power BI Desktop, create a new role that has the following filter.[countryRegionName]= “United States” and [ProductCategory]= “Clothing”
B. Add the following filters in Query Editor.CountryRegionName is United StatesProductCategory is Clothing
C. From Power BI Desktop, create a new role that has the following filters.[CountryRegionName]= “United States”
D. Add the following filters to a report.CountryRegionName is United SatesProductCategory is Clothing
Correct Answer: D
References: https://docs.microsoft.com/en-us/power-bi/power-bi-how-to-report-filter
Pass4itSure PL-300 Practice Test Q&As: 342
To view the last updated PL-300 mock test questions, click here.
Salary & Employment Advice After Becoming a PL-300 Power BI Data Analyst Associate
According to information from several websites (Payscale, ZipRecruiter, Salary.com, and Glassdoor), Microsoft’s PL-300 exam is a step toward becoming a proficient Power BI data analyst, with an average annual salary ranging from $68,067 to $105,610.
- Payscale:$68,067
- ZipRecruiter:$82,640
- Salary.com:$105,619
- Glassdoor:$93,930
When you become a PL-300 Power BI Data Analyst Associate at Microsoft, you can move towards a data scientist. What is a Data Scientist? Data scientists typically require at least a bachelor’s degree in mathematics, statistics, computer science, or a related field to enter the profession. According to data from the U.S. Bureau of Labor Statistics: The median salary for a data scientist is $108,020 per year.
Write at the end:
Do you want such an attractive position?
Everything is done to guide you to pass the PL-300 exam with ease. Shared in the blog: Microsoft PL-300 past and present, PL-300 learning resources, how to prepare for the PL-300 exam, and the latest updated PL-300 exam practice tests (Free). Take action and choose wisely Pass4itSure PL-300 practice test questions https://www.pass4itsure.com/pl-300.html Earn yourself the opportunity to get a high-paying job and strive to become an enviable data scientist.